Transit
Paratransit operations
- Trips, drivers, vehicles: one view
- Risk flagged before pickup
- Demand and cancellations
For demand-response fleets carrying ambulatory and wheelchair riders.
Trip analysis
The phone shows the live picture and records what happened. Those records drive dispatch, staffing and fleet decisions.
On the phone
Live situational picture
- ATAK map: vehicles, stops
- Rider needs on every stop
- Geofence arrival and departure
- Risk markers, dispatch messages
In the analysis
Decision Measurements
- Recorded, not typed, times
- Every trip scored against its window
- Like-for-like comparisons
- Baseline, then change per fix
Book→Dispatch→Drive (ATAK)→Record→Measure→Adjust↺
Key performance indicators
| KPI | Definition | Decision it drives |
|---|---|---|
| On-time pickup | pickups inside window ÷ completed pickups | Schedule padding, driver coaching |
| Productivity | riders carried ÷ vehicle service hours | Fleet size, shift length |
| Deadhead share | miles without a rider ÷ total miles | Trip grouping, garage and shift start points |
| Ride-time ratio | actual ride time ÷ direct drive time | Limits on shared-ride detours |
| Dwell time | departure − arrival at each stop | Rider notice before arrival, stop procedures |
| Late cancel and no-show | late cancels + no-shows ÷ scheduled trips | Confirmation calls, slot reuse |
| Space match | trips on a vehicle fitting the rider ÷ trips | Booking rules, vehicle mix |
| Flagged-trip readiness | risk-flagged trips with matching crew and equipment ÷ flagged trips | Assignment rules for oxygen, bariatric, stairs |
| Vehicle utilization | in-service hours ÷ available hours | Spare ratio, maintenance timing |
| Cost per completed trip | operating cost ÷ completed trips | Funding-source pricing, contract terms |
| Record completeness | trips with every required field ÷ trips | Booking validation, what is captured automatically |
Where the gains are
Group tripsNearby stops, compatible windows.Deadhead share · Productivity · Ride-time ratio
Confirm risky bookingsConfirm likely cancels; refill freed slots.Late cancel and no-show · Productivity
Match the vehicle at bookingSpace type at booking, not at the curb.Space match · On-time pickup
Staff to demandShifts follow trips by weekday and hour.Vehicle utilization · On-time pickup
Shorten stopsRider alerted at geofence entry.Dwell time · On-time pickup
Capture, don't typePhone times; bad values rejected.Record completeness
Quantifying impact
Baseline → one change → re-measure.impact = (baseline − after) × trip volume × unit cost
Unit costs from the operator's own books.
Sample reports
Illustrative data, real format.
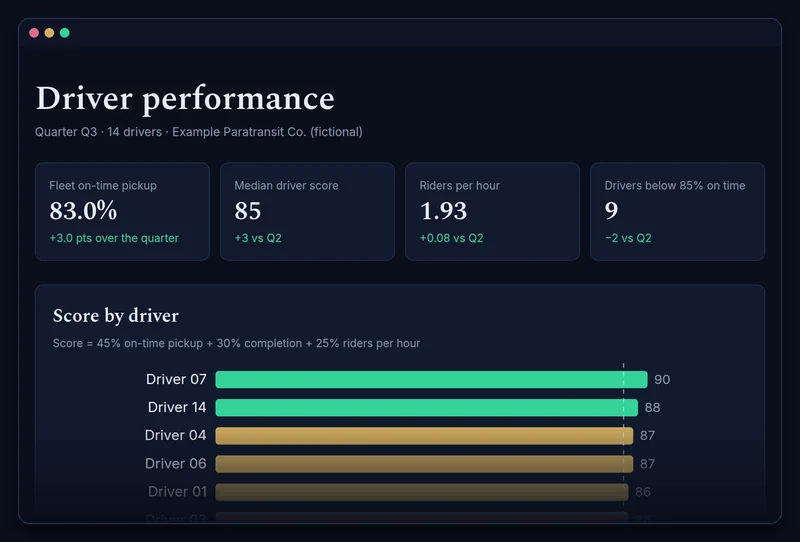 Driver performance
- Score per driver
- On-time by quartile
- Coach / watch / strong
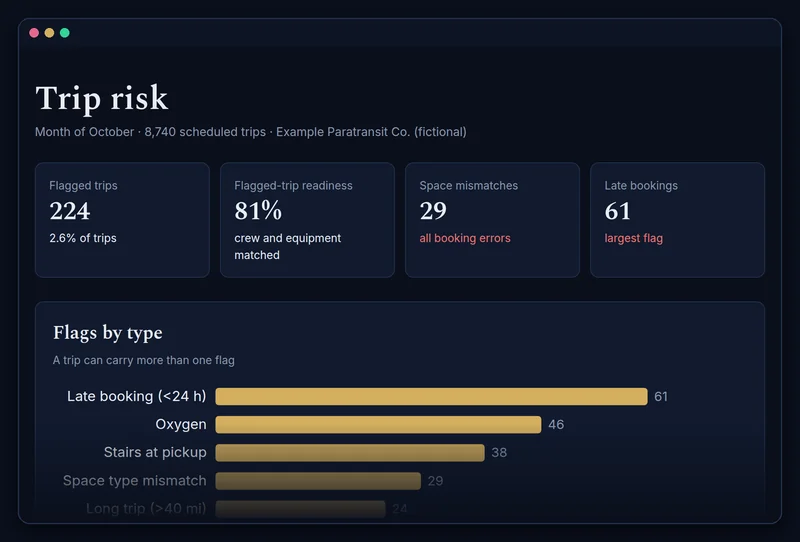 Trip risk
- Flags by type
- Readiness vs target
- Tomorrow's flags
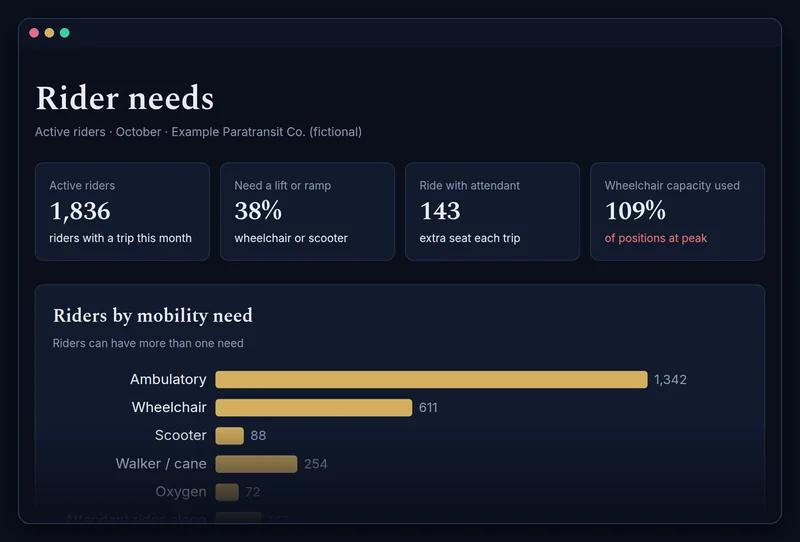 Rider needs
- Mobility needs
- Peak demand vs capacity
- Needs by rider group
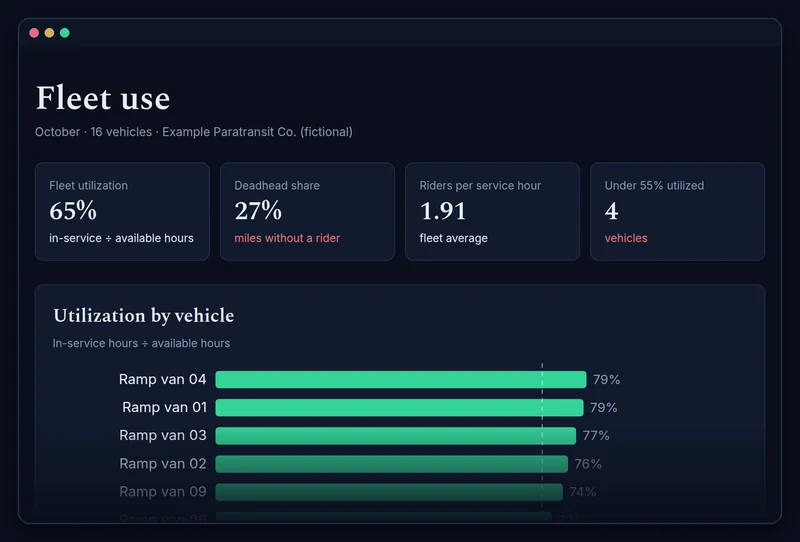 Fleet use
- Utilization per vehicle
- Deadhead by type
- Riders per service hour
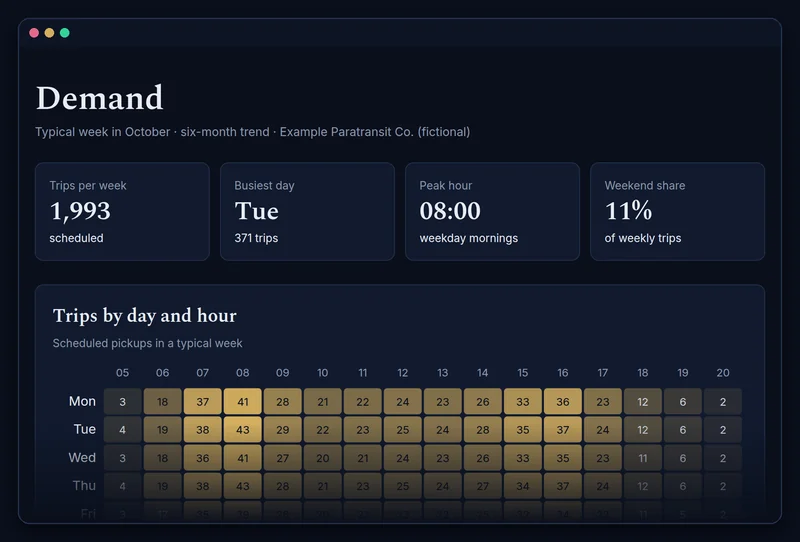 Demand
- Day × hour heat map
- Trips by weekday
- Six-month trend
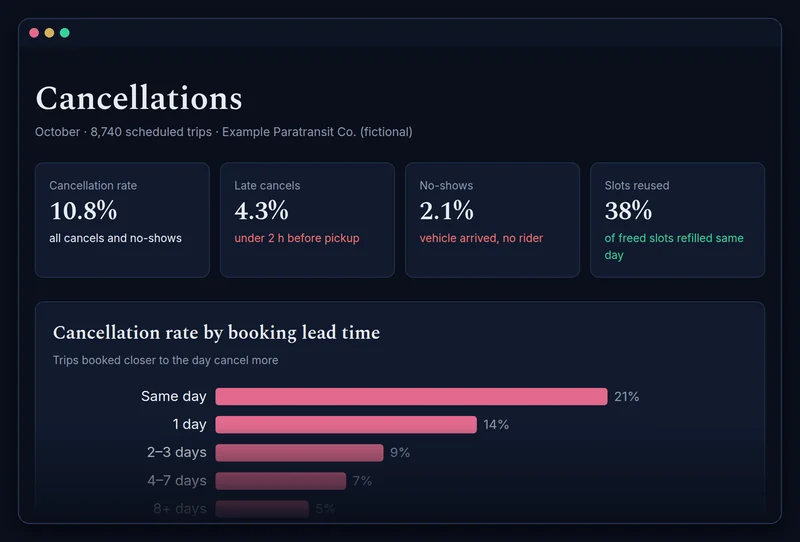 Cancellations
- Rate by lead time
- Rate by funding source
- Weekly trend
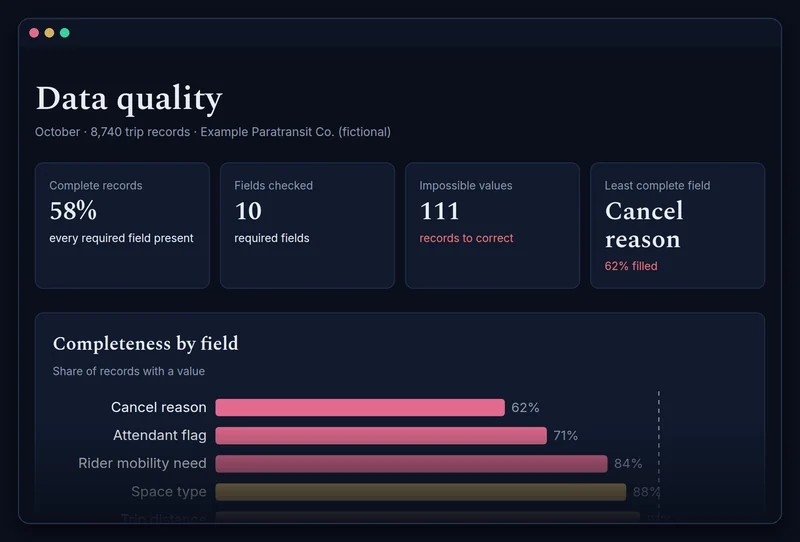 Data quality
- Completeness by field
- Impossible values
- Completeness trend
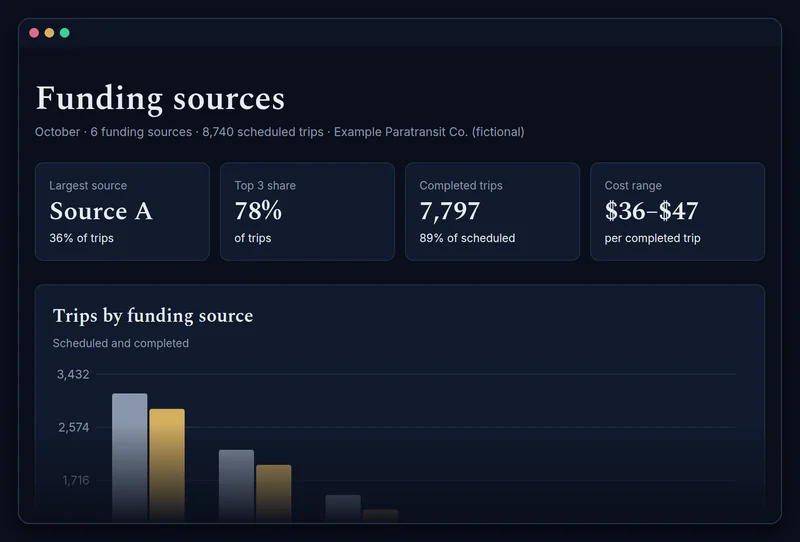 Funding sources
- Scheduled vs completed
- Cost per completed trip
- Source summary